Maps: One Young Man's Tribute to Aimee Mann

Thursday, April 17, 2014

Bilateral Graph

http://www.medscape.org/viewarticle/576121_2

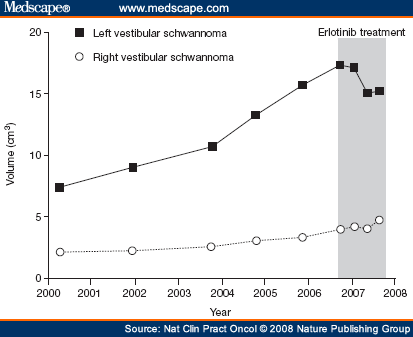
Bilateral graphs compare two different but related sets of data on the same graph. They can be displayed as many different types of graphs including but not limited to line graphs and bar graphs. The bilateral line graph shown above compares the volume of right and left vestibular schwannoma tumors before and during treatment.
Posted by Jake at 8:20 AM
Email ThisBlogThis!Share to XShare to FacebookShare to Pinterest

No comments:

Post a Comment

Newer Post Older Post Home
Subscribe to: Post Comments (Atom)

About Me

My photo
Jake
View my complete profile

Blog Archive

  • ▼  2014 (50)
    • ▼  April (39)
      • Index Value Plot
      • Population Profile
      • Correlation Matrix
      • Similarity Matrix
      • Stem and Leaf Plot
      • Box Plot
      • Histogram
      • Star Plot
      • Triangular Plot
      • Windrose
      • Climograph
      • Scatter Plot
      • Accumulative Line Graph
      • Bilateral Graph
      • Nominal Area Choropleth Map
      • Unstandardized Choropleth Maps
      • Standardized Choropleth
      • Univariate Choropleth maps
      • Bivariate Choropleth Maps
      • Unclassed Choropleth Map
      • Classed Choropleth Map
      • Range Graded Proportional Circle Map
      • Continuously Variable Proportional Circle Map
      • DOQQ
      • DEM
      • LIDAR
      • Doppler Radar
      • B&W aerial photography
      • Infrared Aerial Photo
      • Statistical Map
      • Cartogram
      • Flow Map
      • DLG
      • DRG
      • Isopleth
      • Isopach
      • Isohyets
      • Isotach
      • Isobars
    • ►  March (6)
    • ►  January (5)
Simple theme. Theme images by gaffera. Powered by Blogger.