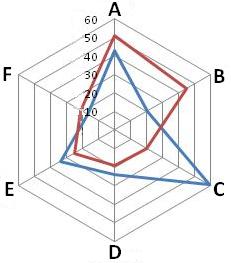
Star plots, more commonly known as radar charts, are for plotting multivariable data. Each variable is represented by an equal spoke (A-F) and the data points are plotted along each spoke. The data points are then connected to gauge the overall magnitude of the data. This technique is commonly applied to quality assessment so one could improve something with multiple standards.
No comments:
Post a Comment